
.png)
ROLE/SERVICES
Product Design Lead · Information Architecture
LOCATION
USA 🇺🇸
YEAR
2025
Summary
Tracing a product back to its source is one of the core promises of a supply-chain platform. BanQu's chain-of-custody view, however, was built as a long linear list. That worked for a simpler commodity like palm oil, where the journey is mostly one step after another. Beer was different: dozens of growers feeding malt houses, elevators, and processors across three ingredient streams, all merging into a single batch. The list stopped being useful. I reframed the problem around the shape of the data. It wasn't really a list, it was a tree. I redesigned the experience as a progressive hierarchy: batch, ingredients, then provenance on demand. The dense transaction layer became an expandable, sortable custody grid. What had been hundreds of rows became a much shorter drill-down that made the supply chain easier to follow and audit.
SaaS blockchain platform
The Challenge
Solution & Impact
Product Design Lead Information Architecture Interaction & UX Design Data-grid & tree-table system Enterprise client delivery
Scope
BanQu's traceability is central to supply-chain compliance. A finished product needs to be traceable, step by step, back to the farms it came from. The original chain-of-custody view showed that journey as one vertical list, read from bottom to top: plantation, collection point, mill, refinery, brand. For a mostly linear commodity like palm oil, that was manageable. Beer exposed the limits of that model. One batch can pull from three separate ingredient streams: hops, barley, and corn. Each has its own path, with dozens of growers feeding processors, storage elevators, and malt houses, and barley adding an extra malting step. When all of that was forced into one column, the structure disappeared. Users had to scroll through long lists while parallel streams and branching relationships were flattened together. For a product built around traceability, the issue wasn't just that the screen was slow to use. The view was making the underlying provenance much harder to understand.
The key insight was simple: the data was a tree, but we were drawing it as a list. I rebuilt the experience around how people actually investigate a batch: start with the whole, open the part you care about, and keep going only as deep as needed. I designed a three-level progressive-disclosure model and the grid underneath it, then worked with engineering to make sure it could handle real production volume. Roll-up: each batch is shown as one card instead of a flood of events. Recipe: opening a batch reveals its ingredients, with each stream collapsed until the user needs it. Custody grid: an expandable, sortable tree-table with source counts and mass-balance information. A long scroll became a short drill-down, and a multi-stream supply chain that was difficult to navigate became much easier to trace.
Client
The platform ingests custody events from growers, processors, storage facilities, and transformation steps. Each event carries IDs, timestamps, quantities, and provenance. Operations such as batching, receiving, transforming, blending, and shipping can also change the shape of the chain by combining or splitting assets. At scale, that creates deep graphs with thousands of relationships. The challenge was to keep those records auditable while still making them fast enough to search, filter, and inspect in everyday use.
The legacy experience was closer to an asset history than a true chain-of-custody view: a bottom-to-top timeline with heavy paging, no clear lineage, and no governed export.
.png)
The design had to make large traceability records practical to work with. That meant stable IDs, deep links, fast browsing, server-side queries, and exports that could be shared safely.
Support tens of thousands of custody events per SKU or season without forcing users through slow paging. The approach combines server-side filtering, a virtualized DataGrid, and cursor pagination.
Reduce manual paging and screenshot-based work. Users can filter by date, facility, or material from one screen, with totals and subtotals available inline.
Keep large datasets responsive while users expand, filter, and move through the chain. The grid loads only the data needed for the current view instead of rendering everything at once.
Let users turn the current view into a secure export without rebuilding it elsewhere. CSV and XLSX downloads stay role-scoped and can be handled in chunks for large datasets.
Make common traceability questions self-service for non-technical users. Saved filters, pinned columns, a column picker, and quick search help people get to the answer without an ops handoff.
Protect sensitive quantities and counterparties.→ Column-level visibility + download gates; audit log for every export.
Make who→what→when→how much obvious across identities.→ Nested lineage view + explicit event types (RECEIVE / TRANSFORM/ BATCH / TRANSFER).
Make audit preparation faster and easier to verify. Stable row IDs, deep links, timestamps, and immutable references help users reconstruct a defensible trail without manually piecing it together.
4h → ≤ 45 min
Per batch → ↓ ~80–90%
4–6h → ≤ 1 h
Per standard request
100%
Of common lookups completed by non-admins (filter • pivot • export) — ops handoffs eliminated
Introduced a Chain of Custody: a purpose-built, expandable Nested DataGrid that reconstructs lineage from verified events and ships governed exports.
Support large custody histories without turning the screen into a performance problem. Server-side filtering, virtualization, and cursor pagination keep the grid usable as the dataset grows.
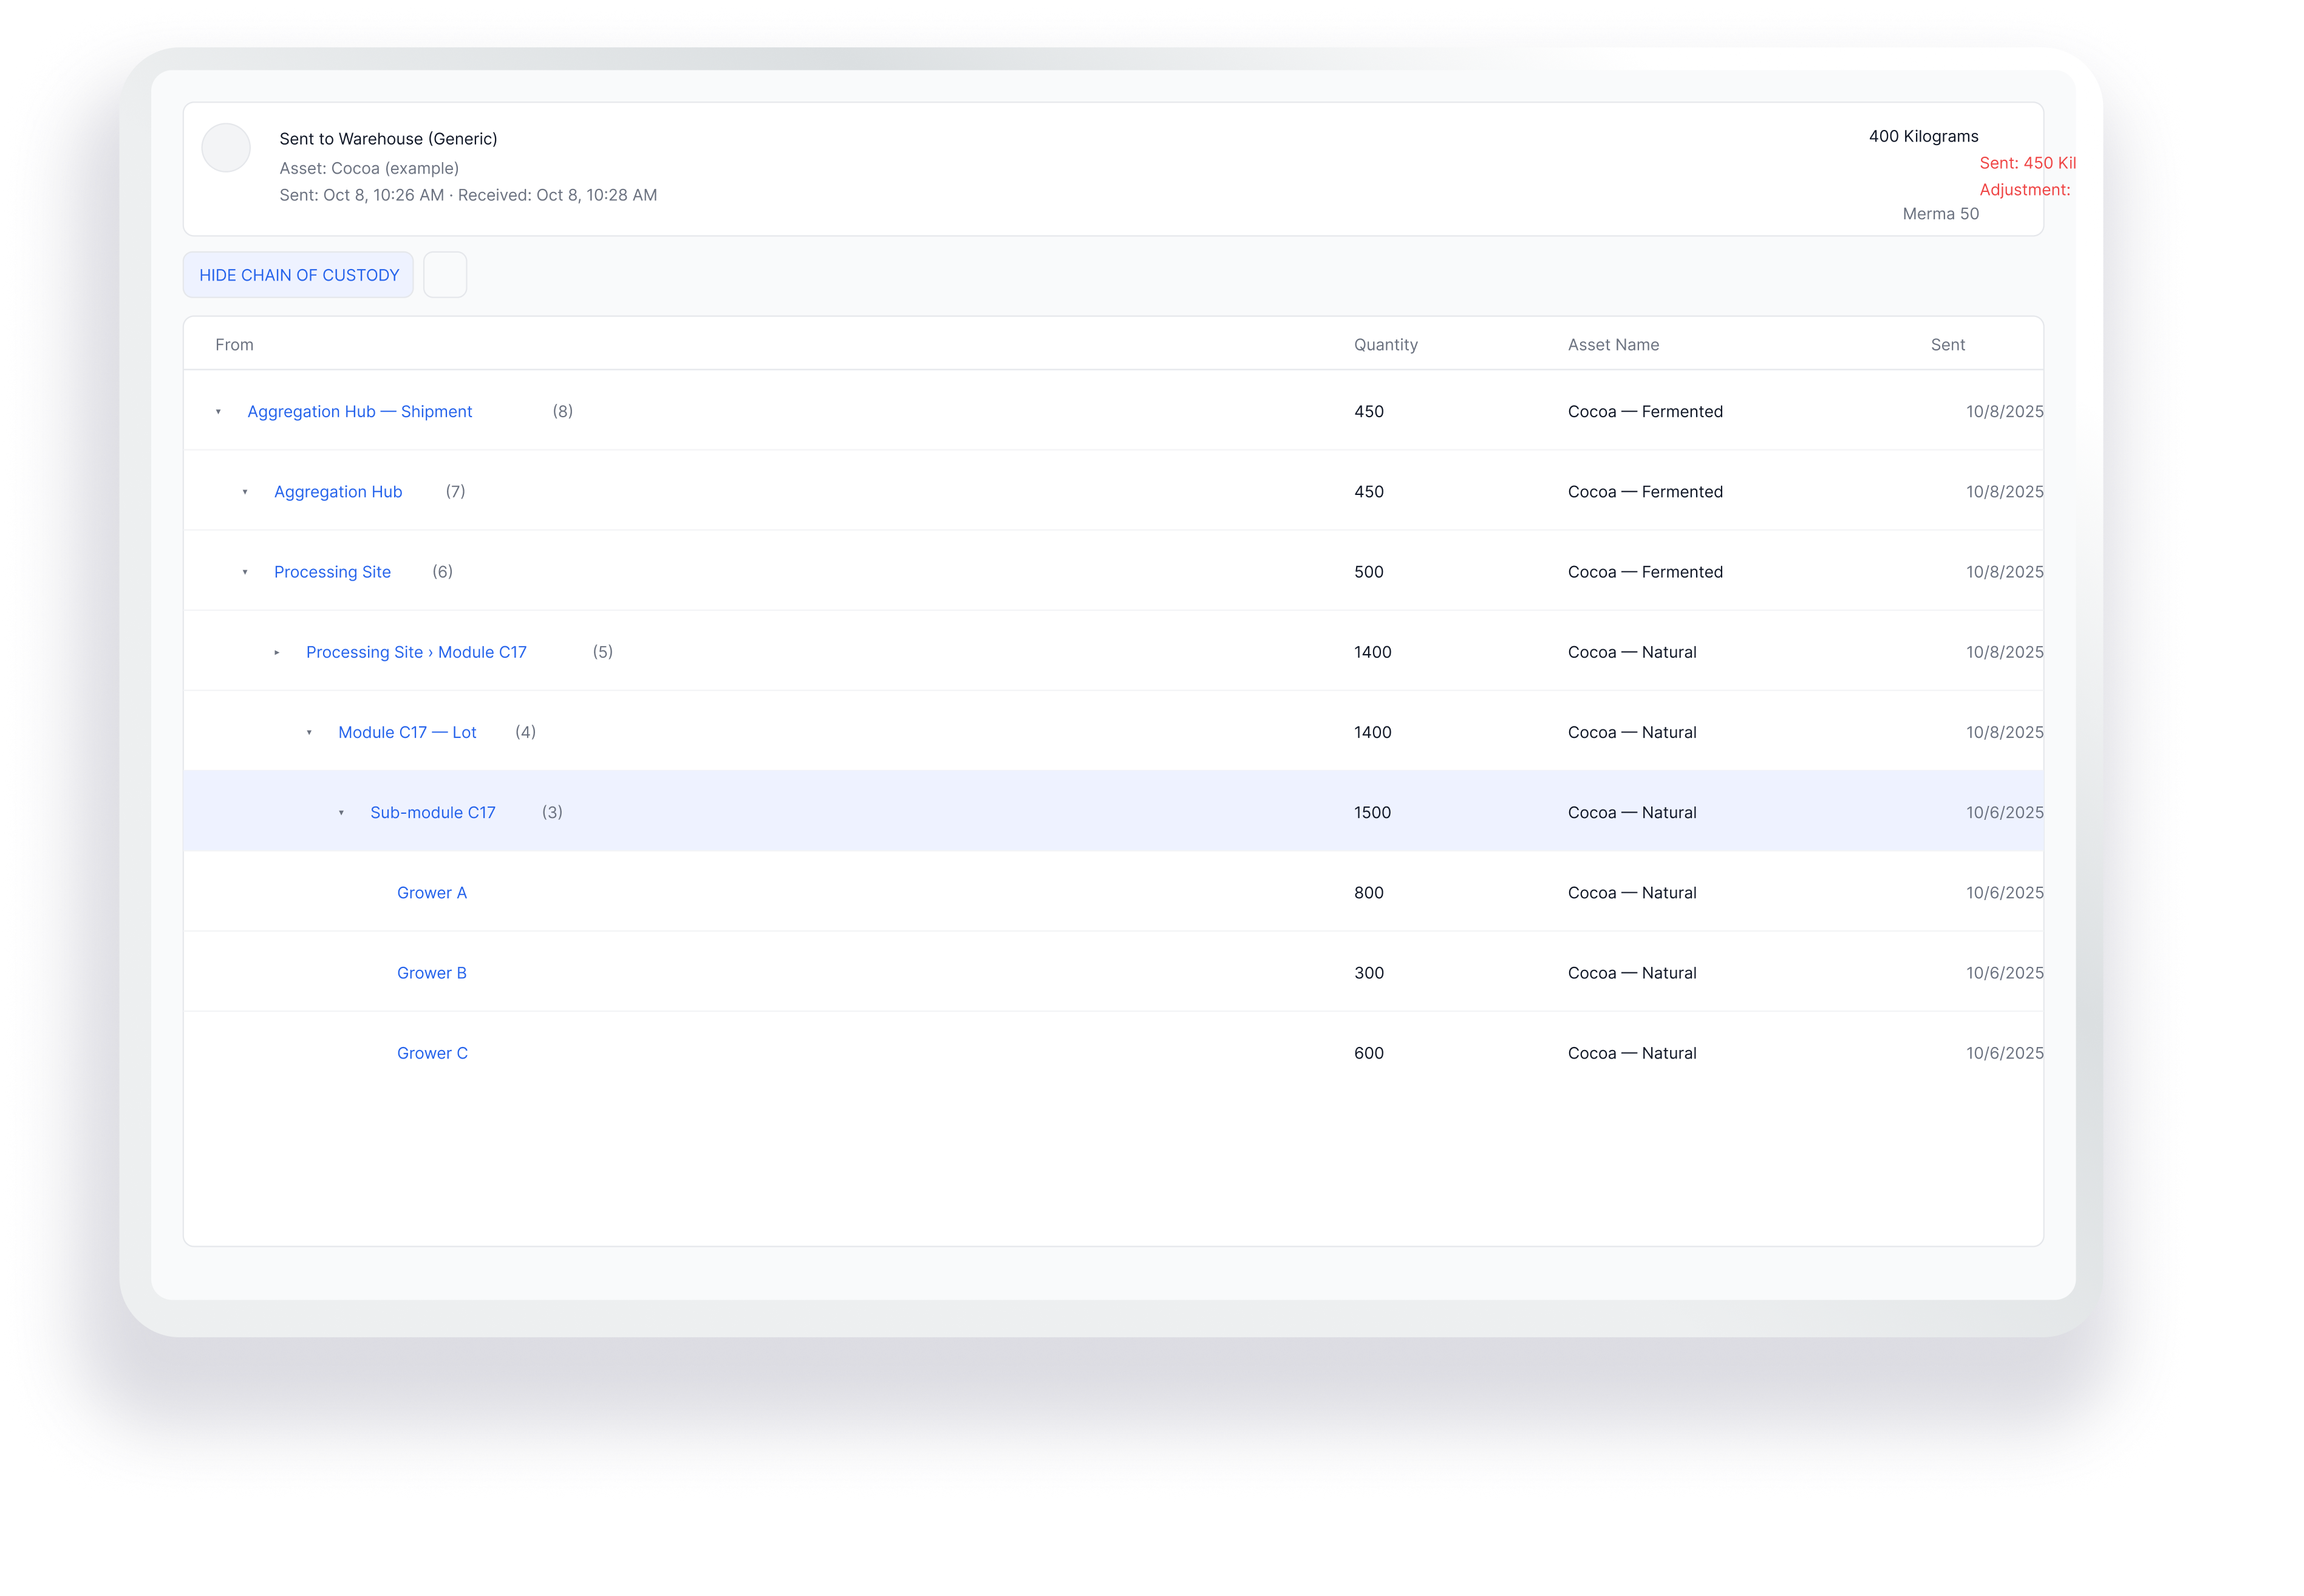
A. Lineage in one screen (expand to trace)What you see: Shipment → Aggregation → Processing → Modules → Growers (nested rows with Quantity • Asset • Sent).Why it matters: Relationships are explicit; no paging. Open only the branches you need.CalloutsExpandable rows show upstream custody.Quantity/Asset/Sent visible at every level.Header chip shows shipment context (sent/received, adjustments).